


Structural magnetic resonance imaging (MRI) studies have found changes in the area, shape, and fractional anisotropy (FA) in the corpus callosum in bipolar disorder.Reference Marlinge, Bellivier and Houenou 1 – Reference Macritchie, Lloyd, Bastin, Vasudev, Gallagher and Eyre 6 Our previous study revealed significantly lower FA values in the anterior part of the corpus callosum in patients with bipolar disorder compared with patients with major depressive disorder (MDD) and healthy individuals, independent of the patients’ affective state. FA value in the frontal corpus callosum was shown to be a prospective stable biological marker for differential diagnosis between bipolar disorder and MDD.Reference Matsuoka, Yasuno, Kishimoto, Yamamoto, Kiuchi and Kosaka 7 These findings indicated a need for more detailed investigation of the ways the pathophysiological processes of bipolar disorder in the corpus callosum might differ from MDD. The corpus callosum, the largest white matter structure connecting the left and right cerebral hemispheres, plays a critical role in interhemispheric communication, particularly in the integration of emotional, cognitive, motor, and sensory information. Abnormalities in the corpus callosum may induce interhemispheric connectivity abnormalities. However, few multimodal imaging studies have examined the effect of structural abnormality of the corpus callosum on the interhemispheric functional connectivity (IFC) in patients with bipolar disorder. We hypothesised that, in bipolar disorder, the resting-state functional connectivity between geometrically corresponding interhemispheric (i.e. homotopic) regions in the anterior part of the cerebral cortical structures would be altered by abnormalities in the frontal corpus callosum. To test this hypothesis, we performed region of interest (ROI) seed-based functional connectivity analyses between ROIs in one hemisphere and their mirrored counterparts in the opposite hemisphere in patients with bipolar disorder and MDD by resting-state functional MRI (rfMRI). We then examined the association of IFC and FA values derived from magnetic resonance-diffusion tensor imaging (MRI-DTI) of the anterior part of the corpus callosum. In homotopic regions where there was significant association between IFC and fractional anisotropy in the corpus callosum (CC-FA), we compared IFC between two groups of patients with bipolar disorder and MDD.
Method
Participants
Patients with bipolar disorder and MDD were recruited from out-patients treated in the Psychiatry Department of Hospital of National Cerebral and Cardiovascular Center, Nara Medical University, and Osaka University, Japan. The study was conducted between August 2011 and July 2015. Patients with bipolar disorder (n=16, 6 women/10 men, mean age (s.d.) = 47.1 (8.6) years) and patients with MDD (n=23, 14 women/9 men, mean age (s.d.) = 44.3 (9.8) years) participating in this study fulfilled the following inclusion criteria: (1) diagnosis of bipolar disorder or MDD based on the structured clinical interview for DSM-IV axis I disorders (SCID); (2) a euthymic or depressive state, but not a manic state (Young Mania Rating Scale (YMRS) <12) on the day of the MRI scan; and (3) age between 20 and 65 years. Exclusion criteria were DSM-IV diagnoses of misuse of or dependence on illicit substances and alcohol, history of organic mental disorder, head trauma, loss of consciousness, seizure disorder, or central nervous system disease. All patients with bipolar disorder met the DSM-IV criteria for bipolar II disorder according to the diagnostic assessment by the SCID.
MRI examinations were conducted once for all patients. Diffusion-weighted MR images and T1- and T2-weighted images were acquired from all individuals. Resting-state fMRI could not be acquired from one patient with bipolar disorder because of complaints of fatigue. Differences in FA of the frontal corpus callosum in the same group of individuals have previously been reported.Reference Matsuoka, Yasuno, Kishimoto, Yamamoto, Kiuchi and Kosaka 7 All patients were subjected to a series of standardised, quantitative measurements of manic symptoms (YMRS) and depressive symptoms (Montgomery–Asberg Depression Rating Scale (MADRS) score) on the day of the MRI scan. This study was approved by the Institutional Review Boards of all participating institutions, and all participants gave written informed consent before enrolment.
Data acquisition of MRI
The MRI examination procedures have been described in detail previously.Reference Matsuoka, Yasuno, Kishimoto, Yamamoto, Kiuchi and Kosaka 7 , Reference Yasuno, Kazui, Yamamoto, Morita, Kajimoto and Ihara 8 All MRI examinations were performed with a 3T whole-body scanner (Signa Excite HD V12M4; GE Healthcare, Milwaukee, WI, USA) with an 8-channel phased-array brain coil. High-resolution three-dimensional T1- and T2-weighted images were acquired. Diffusion-weighted MR images were obtained with a locally modified single-shot echo-planar imaging (EPI) sequence by parallel acquisition at a reduction (ASSET) factor of 2, in the axial plane. Motion probing gradient (MPG) was applied in 55 directions. To reduce blurring and signal loss arising from field inhomogeneity, an automated high-order shimming method based on spiral acquisitions was used before acquiring the DTI scans. To correct for motion and distortion from eddy currents and B0 inhomogeneity, we utilised the FMRIB software (FMRIB Center, Department of Clinical Neurology, University of Oxford, Oxford, England; http://www.fmrib.ox.ac.uk/fsl/). B0 field mapping data were also acquired with the echo time shift (of 2.237 ms) method based on two gradient echo sequences.
The resting-state fMRI scan images were obtained by capturing 37 transverse slices of 4 mm thickness covering the entire brain with a temporal resolution of 3 s, using a T2*-weighted gradient echo EPI pulse sequence (TR=3000 ms, TE=35 ms, flip angle 85°, time frames 88, number of images 3256; acquisition time 4 min 24 s.). For resting-state image acquisition, participants were instructed to remain still with their eyes closed and let their minds wander freely. To reduce blurring and signal loss arising from field inhomogeneity, an automated high-order shimming method based on spiral acquisitions was used before performing DTI and functional MRI scans. FMRIB software was again utilised to correct for motion and distortion derived from the eddy current and B0 inhomogeneity.
DTI data processing and statistical analysis
DTI data processing, statistical analysis, and results have previously been described in detail.Reference Matsuoka, Yasuno, Kishimoto, Yamamoto, Kiuchi and Kosaka 7 FA maps were generated from each individual by FMRIB software.Reference Matsuoka, Yasuno, Taguchi, Yamamoto, Kajimoto and Kazui 9 Exploratory voxel-based analysis was performed by SPM8 software. The difference in FA values between patients with bipolar disorder and MDD was examined by analysis of covariance (ANCOVA) with age, gender, MADRS scores, and duration of illness as covariates, considering the effects of these factors on the white matter microstructure in patients with bipolar disorder or MDD as reported previously.Reference Lenroot and Giedd 10 – Reference Taylor, Macfall, Boyd, Payne, Sheline and Krishnan 12 Spherical volumes of interest (VOIs; 5 mm radius) were determined from the Montreal Neurological Institute (MNI) coordinate with peak t-value in the corpus callosum. The regional FA values were calculated by averaging the values for all voxels within the spherical VOIs placed on regions in FA images of patients with bipolar disorder and MDD.
Resting-state fMRI data processing and statistical analysis
Standard image pre-processing methods were conducted employing the SPM12 software (http://www.fil.ion.ucl.ac.uk/spm/) with the CONN toolbox (http://www.nitrc.org/projects/conn) for functional connectivity analysis. The functional images were corrected for slice time and motion, co-registered with a high-resolution anatomical scan, normalised into the MNI space, resampled at 2 mm3 and smoothed with a Gaussian kernel of 8 mm3 FWHM. In addition, the Artifact Detection Tools (ART: http://www.nitro.org/projects/artifact_detect) were used to measure motion artefacts in all individuals in both groups; we controlled for any motion artefacts by realignment parameters detected with ART.
Seed region definition
We hypothesised that the resting-state functional connectivity between geometrically corresponding interhemispheric (i.e. homotopic) regions in the anterior part of the cerebral cortical structures would be altered by abnormalities of the frontal corpus callosum in bipolar disorder. To test this hypothesis, we performed ROI seed-based functional connectivity analyses between an ROI in one hemisphere and its mirrored counterpart in the opposite hemisphere in patients with bipolar disorder and MDD.
A series of ROIs were defined in the homotopic regions in the anterior part of the cerebral cortical structures including the frontal areas with the caudal limit of the central sulcus and insular cortex (IC) (Fig. 1). A mask for the following distinct subdomains of these regions was provided by the CONN toolbox: frontal pole (FP; MNI coordinates (x, y, z) for the areas, right and left: 26, 52, 8 and −25, 53, 8); insular cortex (IC: 37, 3, 0, and −36, 1, 0); superior frontal gyrus (SFG: 15, 18, 57, and −14, 19, 56); middle frontal gyrus (MidFG: 39, 19, 43 and −38, 18, 42); inferior frontal gyrus, pars triangularis (IFG tri: 52, 28, 8 and −50, 28, 9); inferior frontal gyrus, pars opercularis (IFG oper: 52, 15, 16 and −51, 15, 15); precentral gyrus (PreCG: 35, −11, 50 and −34, −12, 49); and frontal orbital cortex (FOrb: 29, 23, −16 and −30, 24, −17).
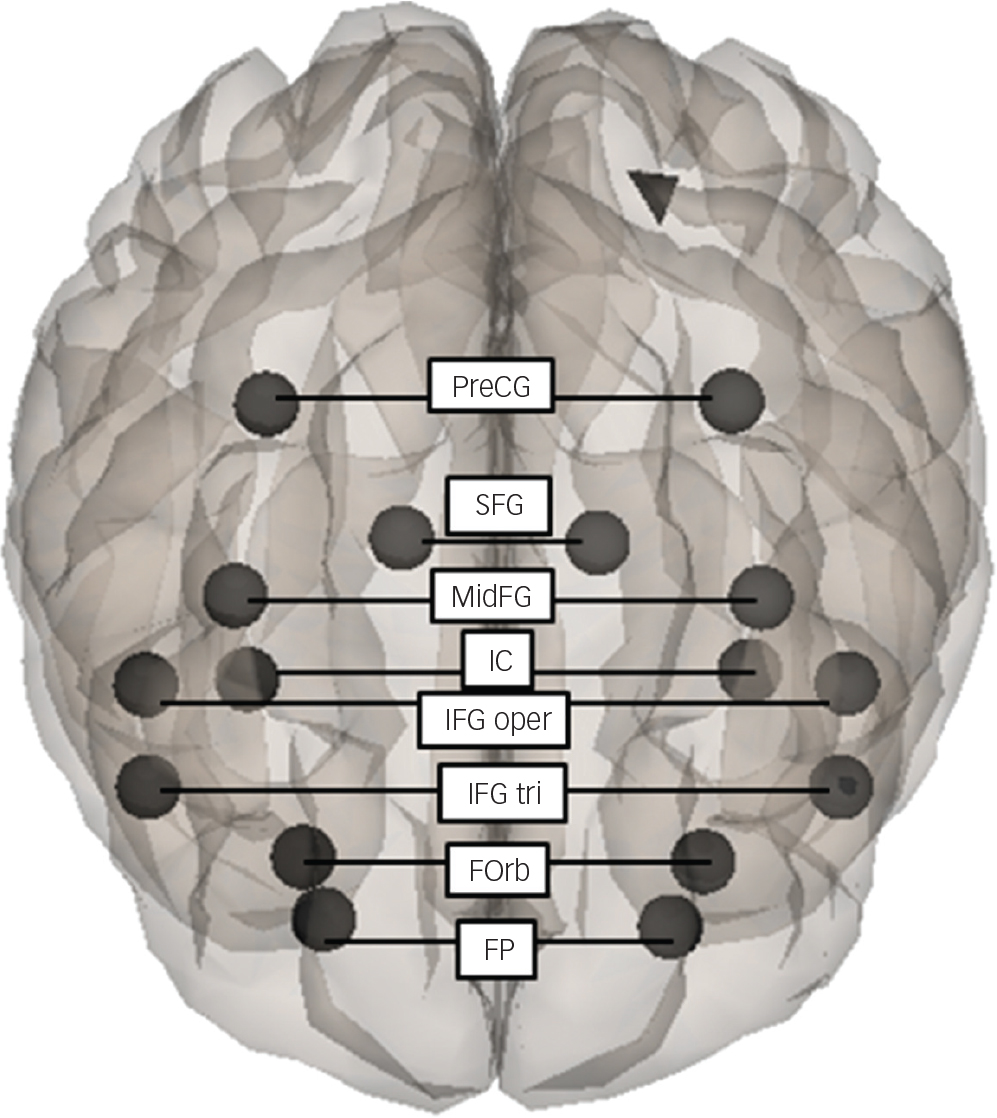
Fig. 1 A series of ROIs defined on the homotopic regions in the anterior part of the cerebral cortical structures. ROI-to-ROI seed-based functional connectivity analysis was performed between the homotopic regions: frontal pole (FP); frontal orbital cortex (FOrb); inferior frontal gyrus, pars triangularis (IFG tri); inferior frontal gyrus, pars opercularis (IFG oper); insular cortex (IC); middle frontal gyrus (MidFG); superior frontal gyrus (SFG); precentral gyrus (PreCG).
Functional connectivity analysis
Following the pre-processing steps outlined above, functional images were imported into the CONN toolbox in SPM12 for further data correction. The blood oxygenated level-dependent (BOLD) signal data were passed through a band pass filter (0.009–0.08 Hz). The mean BOLD signal time course was then extracted from each of the predefined ROIs. The time course for each ROI was then correlated with the time course for each of the other ROIs, allowing for the calculation of a correlation coefficient for each ROI by Pearson's product–moment calculation. We performed ROI-to-ROI seed-based functional connectivity analyses between the homotopic areas in order to examine the association of the FA values of the frontal corpus callosum and the IFC between the homotopic regions in the anterior part of the cerebral cortical regions in patients with bipolar disorder and MDD.
Statistical analysis
Group differences in demographic characteristics between patients with bipolar disorder and MDD were examined by unpaired t-tests and Pearson's χ 2 -tests. We performed partial correlation analyses to examine the relationship between the FA values in the anterior part of the corpus callosum and the IFC in the homotopic regions with age, gender, MADRS scores, and duration of illness as covariates. In regions where there was a significant correlation between IFC values and the FA in the frontal corpus callosum, the group differences of mean IFC values of these regions were compared between bipolar disorder and MDD by ANCOVA using age, gender, and years of education as covariates. All statistical tests were two-tailed and reported at α<0.05. Statistical analysis of the data was performed by SPSS for Windows 22.0 (IBM Japan Inc., Tokyo, Japan).
Results
Demographic and clinical data
Table 1 summarises the demographic characteristics of the participants in the study. There were no significant differences in age, gender, or years of education between groups. Patients with bipolar disorder and MDD showed no significant differences in the age at onset or psychiatric scores on YMRS. Patients with bipolar disorder tended to have a longer duration of illness, and based on the MADRS score, patients with MDD tended to be more depressed than those with bipolar disorder, although these differences were not significant. All patients with bipolar disorder were on lithium and/or other mood stabilisers during the study, whereas only three individuals with MDD were medicated with these drugs. There was no significant difference in medication with antidepressants, antipsychotics, and benzodiazepine drugs between the bipolar disorder and MDD groups.
Table 1 The summary of the demographic characteristics in the participants of the study
| Characteristic | BP | MDD | t or χ2 | P |
|---|---|---|---|---|
| (n=16) | (n=23) | |||
| Age, years | 47.1±8.6 | 44.3±9.8 | t=0.87 | 0.39 |
| Female, n (%) | 6 (37.5%) | 14 (60.9%) | χ2=2.06 | 0.15 |
| Education, years | 14.6±1.8 | 14.7±1.9 | t=0.11 | 0.91 |
| Family history, n (%) | 4 (25.0%) | 6 (26.1%) | χ2=0.01 | 0.62 |
| Onset (age in years) | 36.6±11.0 | 38.6±8.1 | t=0.63 | 0.53 |
| Duration of illness (years) | 10.4±6.3 | 6.0±7.4 | t=1.90 | 0.07 |
| Young Mania Rating Scale (YMRS) | 0.7±2.7 | 0.0±0.0 | t=1.00 | 0.33 |
| Montgomery Asberg Depression Rating Scale (MADRS) score | 12.0±11.8 | 18.7±11.0 | t=1.77 | 0.09 |
| Medication, n (%) | ||||
| Lithium | 10 (62.5%) | 1 (4.3%) | χ2=15.8 | <0.001 a |
| Other mood stabiliser | 7 (43.8%) | 2 (8.7%) | χ2=6.53 | 0.02 a |
| Antidepressant | 7 (43.8%) | 15 (65.2%) | χ2=1.77 | 0.18 |
| Antipsychotic | 6 (37.5%) | 6 (26.1%) | χ2=0.58 | 0.34 |
| Benzodiazepines | 13 (81.3%) | 12 (52.2%) | χ2=3.47 | 0.06 |
a P<0.05.
BD, bipolar disorder; MDD, major depressive disorder.
FA changes and its correlation with IFC
As shown in the previous study, the results revealed significantly lower FA values in the anterior part of the corpus callosum in patients with bipolar disorder compared with MDD, which did not depend on the patients’ affective state (x, y, z=−12, 28, 18; 416 voxels; t=5.21; P<0.001; Fig. 2a). We found a significant positive correlation between the FA in the corpus callosum and the average of the IFC values of all measured homotopic regions in the anterior part of the cerebral cortical structures (Table 2). In consideration of the above finding, we expected significant correlations between the CC-FA and IFC in some of the individual homotopic areas. Therefore, we did not apply a multiple comparison correction for the analysis of the individual areas. As expected, we found a significant relationship between the CC-FA and IFC of the IC, IFG tri, and FOrb (Table 2). Figure 2b shows the scatterplot of the significant partial correlation between the CC-FA and the average of the IFC of the IC, IFG tri, and FOrb (r=0.53, P=0.001), with age, gender, MADRS scores, and duration of illness as covariates. Figure 2c shows the difference in average IFC values between patients with bipolar disorder and patients with MDD in these regions. Our results revealed significantly lower IFC of these homotopic areas in patients with bipolar disorder when compared to patients with MDD (F 1,32=4.79; P=0.036; adjusted IFC values with age, gender, MADRS scores, and duration of illness: bipolar disorder: 0.44 (s.d.=0.17), MDD: 0.58 (s.d.=0.14)).
Table 2 Partial correlations between the CC-FA and IFC of the homotopic areas among patients with age, gender, disease duration, and MADRS score as covariates
| Regions | Correlation (r) | P |
|---|---|---|
| Average of IFC values of all of measured homotopic regions | 0.35 | 0.04 a |
| Individual homotopic regions | ||
| FP (frontal pole right) | 0.26 | 0.14 |
| IC (insular cortex right) | 0.40 | 0.02 a |
| SFG (superior frontal gyrus) | −0.25 | 0.16 |
| MidFG (middle frontal gyrus) | −0.05 | 0.77 |
| IFG tri (inferior frontal gyrus, pars triangularis) | 0.40 | 0.02 a |
| IFG oper (inferior frontal gyrus, pars opercularis) | 0.19 | 0.28 |
| PreCG (precentral gyrus) | 0.21 | 0.24 |
| FOrb (frontal orbital cortex) | 0.38 | 0.03 a |
a P<0.05.
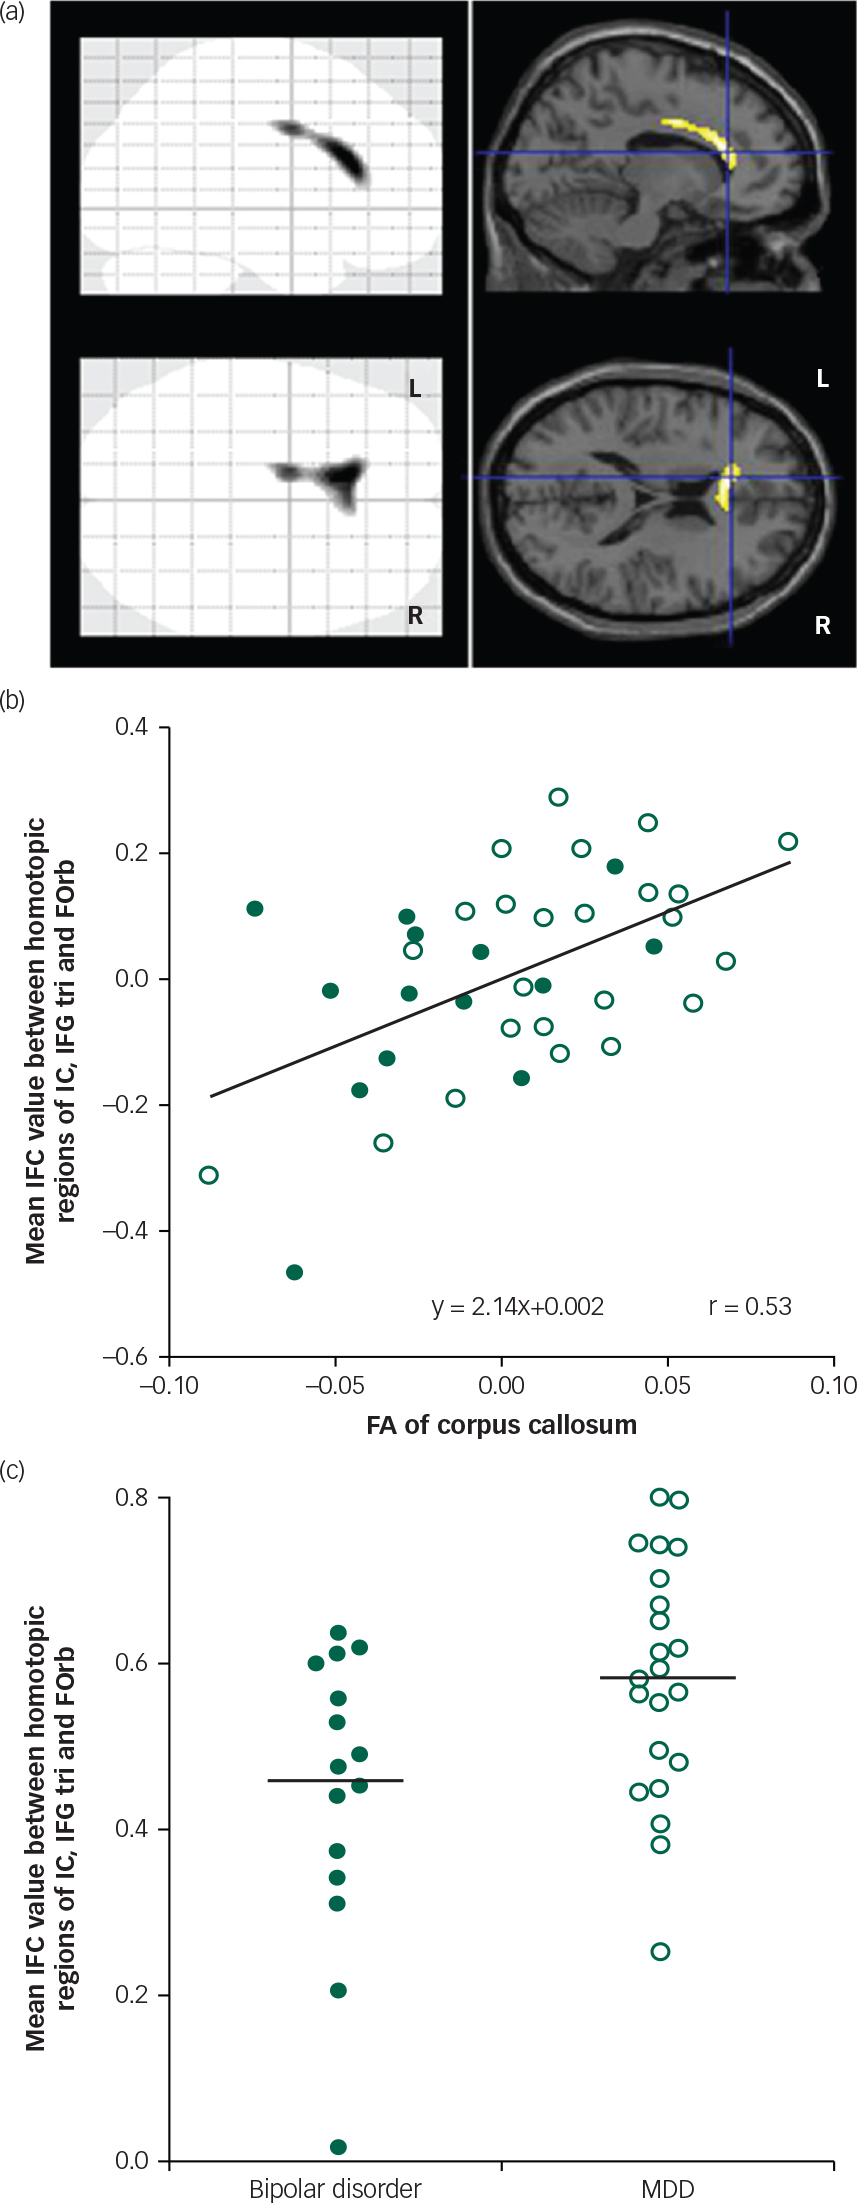
Fig. 2 (a) Regions with significant differences in fractional anisotropy (FA) values between patients with bipolar disorder and major depressive disorder (MDD). Sagittal and transverse brain views show voxels with significantly lower FA values in patients with bipolar disorder than patients with MDD. MNI coordinates for the crosshairs are x=−12, y=28, z=18. (b) Partial correlation between FA of corpus callosum and mean IFC value of IC, IFG tri, and FOrb in all patients. There was a significant positive correlation between the FA of corpus callosum and mean IFC values when controlling for age, gender, disease duration, and MADRS score. Filled circle: bipolar disorder patients; open circle: MDD patients. (c) Scatter plots of mean IFC values of IC, IFG tri, and FOrb in patients with bipolar disorder and MDD. IFC values were significantly lower in patients with bipolar disorder when compared to patients with MDD. IFC values were adjusted with the age, gender, disease duration, and MADRS score. Filled circle: bipolar disorder patients; open circle: MDD patients.
Discussion
Consistent with previous study, patients with bipolar disorder showed significantly lower FA values in the anterior part of the corpus callosum compared with patients with MDD. The low anisotropy in the corpus callosum of patients with bipolar disorder has been reported before.Reference Matsuoka, Yasuno, Kishimoto, Yamamoto, Kiuchi and Kosaka 7 , Reference Barysheva, Jahanshad, Foland-Ross, Altshuler and Thompson 13 – Reference Mahon, Burdick and Szeszko 15 Our finding, however, is the first to highlight that structural abnormality within the frontal corpus callosum is relevant to the resting-state functional connectivity between geometrically corresponding interhemispheric regions in the anterior part of the cerebral cortical structures. Compared with MDD, significantly lower IFC values were associated with lower CC-FA values in the homotopic cortical regions in patients with bipolar disorder during depressed or euthymic states.
The corpus callosum has been generally studied in order to elucidate the pathophysiology underlying bipolar disorder. A meta-analysis has been reported of imaging studies of corpus callosum abnormalities in brain volumesReference Arnone, McIntosh, Chandra and Ebmeier 16 and a review of studies of white matter microstructureReference Bellani, Yeh, Tansella, Balestrieri, Soares and Brambilla 17 among patients suffering from bipolar disorder. In our previous study,Reference Matsuoka, Yasuno, Kishimoto, Yamamoto, Kiuchi and Kosaka 7 lower CC-FA in patients with bipolar disorder was shown to be associated with higher radial diffusivity values, which could be interpreted as a disruption of myelin.Reference Alexander, Lee, Lazar and Field 18 Demyelination decreases the function of the white matter tracts of the corpus callosum and might be related to the altered expression of glial and myelination genes described in patients with bipolar disorder.Reference Mahon, Burdick and Szeszko 15 Evidence from previous reports indicates that genes related to oligodendrocytes and myelin appear to be abnormally expressed in bipolar disorder.Reference Tkachev, Mimmack, Ryan, Wayland, Freeman and Jones 19 , Reference Carter 20 Tkachev et al Reference Tkachev, Mimmack, Ryan, Wayland, Freeman and Jones 19 reported a downregulation of erbB in bipolar disorder, a receptor for neuregulin1 (NRG1) that is known to be a growth factor crucial to myelination. Loss of NRG1-erbB signalling in oligodendrocytes in the adult brain has been shown to lead to reduced myelin thickness. This signalling pathway may also contribute to mental disorders through non-genetic mechanisms, as both NRG1 and erbB expression can be altered by environmental stressors such as forced locomotion.Reference Roy, Murtie, El-Khodor, Edgar, Sardi and Hooks 21
Because the corpus callosum is a white matter midline structure that connects the two cerebral hemispheres and allows interhemispheric communication, impairment in the white matter connectivity of the corpus callosum could disrupt functional integration and coordination. Owen et al Reference Owen, Li, Yang, Shetty, Bukshpun and Vora 22 reported that patients with agenesis of the corpus callosum showed significantly reduced IFC on rfMRI. Our finding of an association between CC-FA and IFC for homotopic regions is consistent with these notions. Additionally, ShobeReference Shobe 23 presented a remarkable model concerning emotional regulation. In this model, the right hemisphere mediates the identification and comprehension of emotional stimuli, and the left hemisphere processes emotional information that has been shared within the hemispheres via the corpus callosum. Any microstructural abnormalities in the corpus callosum may degrade the exchange of emotional information between the hemispheres. The resulting emotional dysregulation could trigger affective instability in patients with bipolar disorder.
Direct structural connectivity via the corpus callosum does not appear to be the only determinant of the functional connectivity in healthy brains. Reported rfMRI studies of split-brain patients found that a normal complement of resting-state networks and intact functional coupling between bilateral hemispheres can emerge in the absence of the corpus callosum,Reference Tyszka, Kennedy, Adolphs and Paul 24 suggesting that IFC may thus arise from common subcortical drivers or complex network-level synchronisation. However, our finding of a direct association between CC-FA and IFC indicates that at least one function of the corpus callosum is as a strict determinant of the IFC, and its impairment could disrupt interhemispheric functional integration and coordination, which could be relevant to the pathophysiology of bipolar disorder.
Especially significantly lower IFC values associated with reduced CC-FA values were found in the homotopic ventral prefrontal cortex (IFG tri and FOrb) and IC in patients with bipolar disorder compared with MDD. The brain systems most likely to underlie bipolar disorder involve those that modulate emotional control, and the ventral prefrontal cortical areas and the insula cortex have consistently been associated with conscious emotional experience.Reference Bush, Luu and Posner 25 – Reference Reiman, Lane, Ahern, Schwartz, Davidson and Friston 28
The insula has been implicated in unsuccessful response inhibitionReference Ramautar, Slagter, Kok and Ridderinkhof 29 and emotion processingReference Phillips, Young, Senior, Brammer, Andrew and Calder 30 , Reference Malhi, Lagopoulos, Sachdev, Ivanovski, Shnier and Ketter 31 and has extensive reciprocal connectivity with the ventral prefrontal regions.Reference Augustine 32 , Reference Ongür and Price 33 Two ventral prefrontal networks appear to modulate emotional behaviour.Reference Yamasaki, LaBar and McCarthy 34 – Reference Phan, Wager, Taylor and Liberzon 37 Both of these networks are organised in specific ventral prefrontal regions and map to specific striatal, pallidal, and thalamic brain areas to form iterative feedback loops that process information and modulate other limbic brain areas.Reference Yamasaki, LaBar and McCarthy 34 – Reference Townsend and Altshuler 38 One network originates in the ventrolateral prefrontal cortex and is thought to modulate external emotional cues, such as in affective face tasks.Reference Townsend and Altshuler 38 , Reference Chen, Suckling, Lennox, Ooi and Bullmore 39 The other network originates in the ventromedial (orbitofrontal) cortex and is thought to modulate internal emotional stimuli (e.g. sadness in response to personal events).Reference Yamasaki, LaBar and McCarthy 34 , Reference Lane, Reiman, Ahern, Schwartz and Davidson 40 Impairment of the interhemispheric functional integration and coordination of these emotion-regulation networks because of the abnormality of the corpus callosum is thought to serve as a likely substrate for the functional neuroanatomy of bipolar disorder.
Study limitations
There were several limitations to the present study. First, the sample size of our study was not sufficiently large. We cannot exclude the possibility that the lack of significant differences in the imaging results and some demographic variables between groups is because of the effect of type II error. The partial correlations did not survive the Bonferroni correction between the CC-FA and IFC, which was possibly affected by the relatively small sample size of our study. Further, our study lacked a healthy control group, which made it difficult to position the results. Second, patients with bipolar disorder tended to have a longer duration of illness and a lower MADRS score than those with MDD. Although we analysed our data using duration of illness and MADRS score as covariates, this tendency should be taken into consideration. Third, the MDD and bipolar disorder groups differed regarding ongoing medications, particularly with respect to lithium. Lithium medication could thus be a potential confounder of the FA and IFC results. However, even if lithium medications exerted some effect on these results, the partial correlation analyses between the FA values in the corpus callosum and the IFC in the homotopic regions remained unchanged even when we added lithium medications as a covariate to the analyses (all of measured homotopic regions: r=0.35, P=0.05; IC: r=0.41, P=0.02; IFG tri: r=0.03, P=0.39; FOrb: r=0.36, P=0.04). Nonetheless, studies examining patients newly diagnosed with bipolar disorder and MDD who have not been previously medicated would be useful in ruling out these effects. Fourth, our method of correlating IFC with a number of cortical areas using a single, spherical 5-mm voxel might have overlooked some of the meaningful connecting pathways that did not travel through that voxel. Fifth, we could not obtain reliable medical records of the exact number of bipolar disorder episodes because it was not uncommon for patients to consult multiple medical institutions during their relatively long disease duration. Therefore, we could not examine whether there were correlations between FA and IFC values and the number of episodes of bipolar disorder. Finally, the abnormal corpus callosum integrity and its relevant lower IFC between homotopic regions in patients with bipolar disorder were not dependent on the patients’ depressive state as measured via the MADRS score. However, we did not have available FA values in the corpus callosum and its related IFC in patients with bipolar disorder during a hypomanic state. Therefore, in this study, we could not determine whether these could be regarded as a trait unrelated to the depressive and hypomanic states. Further studies with an increased number of drug-free participants including healthy controls and patients with bipolar disorder in a hypomanic state would be necessary to address these limitations.
Implications
The present study revealed that patients with bipolar disorder had microstructural abnormalities in the anterior part of the corpus callosum during a depressed or euthymic state. Further, structural abnormalities within the frontal corpus callosum were relevant to the resting-state functional connectivity between geometrically corresponding interhemispheric regions in the anterior part of the cerebral cortical structures. Abnormalities in the corpus callosum may be related to the exchange of emotional information between the cerebral hemispheres, especially in the ventral prefrontal cortex and insula, resulting in emotional dysregulation. Further investigation with a larger number of patients with bipolar disorder is needed to clarify whether and, if so, how the low IFC affects the clinical presentation and treatment response of bipolar disorder.
Acknowledgements
The authors thank the staff of the MRI facility at the Department of Investigative Radiology of the National Cerebral and Cardiovascular Center in Japan for data acquisition during the MRI procedure.


 Open access
eLetters
No eLetters have been published for this article.